La última presentación que se ha realizado del proyecto fue en el congreso bianual de la sección Digital Culture and Communication de la asociación ECREA el 7 de noviembre de 2017 en Brighton. Allí presentamos la comunicación ‘Visualizing Data in a mixed methodology context’, donde reflexionamos críticamente sobre la necesidad de crear modelos de visualización de datos donde se puedan incorporar también los datos cualitativos en aquellos proyectos o propuestas donde se realiza una apuesta por un método mixto.
Abstract:
In the Selfiestories project we have approached the selfie phenomenon in the context of user’s personal narratives (Georgakopoulou, 2016) embedded in the everyday. These situated stories can be expressed as collective narratives (Fallon, 2014) in different ways, through shared moods, identities or practices connected through time and space. The research process have led us to focus on extraordinary events like music festivals (San Cornelio, Roig and Ardevol, 2017), but also on recurring ordinary events, like young people nightlife at weekends, but also on stories based on shared personal identities and life-changing experiences, like sexualities, motherhood or health conditions.
We have opted for a mixed methodology (Markham, 2013), combining fieldwork and ethnographic techniques with quantitative data (Wang, 2013) obtained through an Instagram data extractor developed specifically for the project. This approach has proved challenging in the process of analysing the data, establishing a dialogue between different kinds of datasets, identifying relations between cases and in laying out our results. At the latter stage, the main challenge has been creating visual formats to explain and connect our results (Knigge, 2006).
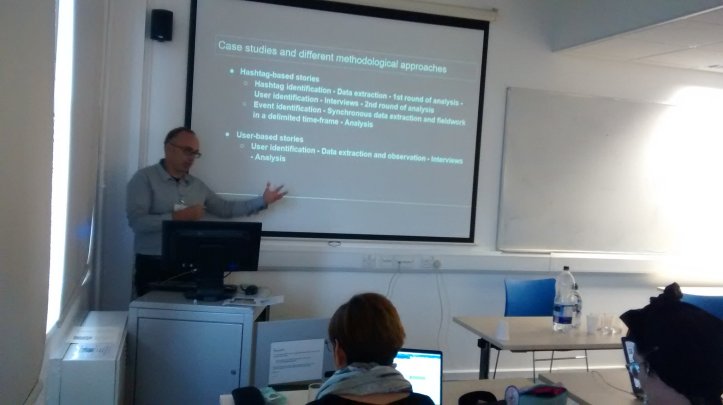
We have performed a total of 5 case studies; in the more hashtag-based, a ‘big data’ approach becomes predominant, being complemented by onsite fieldwork whenever possible (such as in the Primavera Sound Case). On the contrary, In user-based cases, greater prominence has been given to online ethnography and interviews, while quantitative datasets have proved useful to connect cases and to relate the micro-level to the macro-level. An example of this is the use of selfies about health issues.
In this presentation we will focus on how visualization (Manovich, 2011) can be applied to a complex dataset organized in different case studies that involve both qualitative and quantitative data. We will deal with issues of standardisation (Kennedy et al 2016) and objectivity (Cairo, 2016) in data representation, but also with how innovation is possible in this field. Particularly in those formats that use qualitative information (Sloane, 2009) and those more complex cases that combine both sources. Here, we state that storytelling can play a fundamental role in organizing the different layers of information.
